 Financelyzer Consulting Bureau for Studies and Financial Analyzing
Related Articles


 Many articles are portraying nowadays a big concern about the current international market situations warning from another possible financial crisis. Furthermore, other analysts are saying that the market is entering a recession phase taking in their calculations many economical and financial indicators and tools. One of the most recently used indicator is the yield curve rate. Generally, the capitalist economy depends on financial banking system in the first place to boost the financial markets or to slow down the inflation. Yield curve rate reflects the financial behavior of investors, and shows how they react to market changes based on their fear in the time of crisis and greed for having profits in the booming period.
Economist and analysts take the yield curve rate as an indicator to predict the upcoming or ongoing recession/crisis as well. In addition, the U.S. Department of the Treasury issues many bills at different maturities, starting from 3-month bills and end up to 30-year bills (bond). Typically, bonds with longer maturities have higher yields and bonds with shorter maturities have lower yields. In the well (booming) economy the Treasury Yield Curve should take the following shape, chart 1.
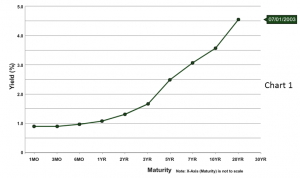
Having this shape means that the investors are willing to get their portfolio to have a faster turnover by buying short-term bonds, so they can double their benefit by reinvesting repeatedly in a particular period. Increasing the demand on short-term bills (1, 3, 6 months and one year) lifts its prices up and its rate goes down. On the other hand, by decreasing the demand on long-term bills (5, 7,10,20,30 year) its prices inversely are going down and its rate is going up. Therefore, the difference between yields for long-term and short-term bonds has been expanding.
However, in time of crisis the yield curve is represented by chart 2.
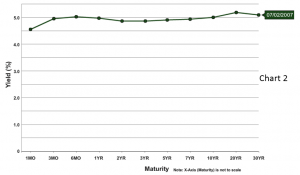
It has this shape because the investors are willing to buy safe heaven-bond (the 20 or 30-year bills) in their portfolio and stop buying short-term bonds, so they can hedge their position until the crisis passes away. By decreasing the demand on short-term bills (1, 3, 6 months and one year), its prices will decrease and its rate will go up. On the other hand, if demand was higher on long-term bills (5, 7,10,20,30 year) its prices will go up and its rate will go down. Therefore, the difference between yield rates for long-term and short-term bonds has been shrinking.
The curve in the chart 2 is called flat yield curve, which reflects the difference between short and long-term rates and it is often an indicator used by economists to predict recessions. This illustrates clearly the situation in 2007 among the financial crisis.
Periodically, by looking at Treasury bill rates for 27-year time span, it could be obviously distinguished when the crisis has hit the economy and when it is over. Chart 3 reveals the yield curve rate difference between 3 months and 20/30 years T-bills (Treasury bills) which mirrors the investor’s behavior linked with the crisis in 1994-1996 and 1998. In addition, it explains the crisis around 2011 and similarly 2007 reaching to 2016.
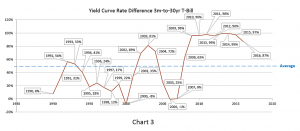
Clearly, the crisis/recessions in this chart are in 1990, 1995, 1998, 2000, 2006, and 2007. Recession of 1990 could be in relationship with gulf war I. Furthermore, in 1995 and 1996 reveals the recession that took place in Asia. We should also keep in mind the mix box strategy (mixed monetary and fiscal policy) that was used by Clinton administration in 1998 to stimulate the economy, as its effect can clearly be seen on the graph.
Thereafter, it shows the crisis of 2000-2001, which was very hard because of the difference between 3m and 30yr T-bill which was -8%. Later on, the recession in 2006-2007 reached -1% which ended in August 2009 as conveyed in chart 3. The negative value means that the short-term rate is higher than the long-term rate. In 2009, the department of treasury cut the rate sharply to an extent that it reached 0.14 for 3 months bill in order to stimulate the economy. It kept cutting the rate since 2008 to maintain stimulation of the economy until the rate reached 0.01 % in 2014, which was the lowest rate in the monetary history.
Moreover, technical analysis shows that the start/end of a recession could be predicated by using the average of 27 years rates (which is 51%). If the curve of yield approaches and crosses down the average line, we could say that the recession phase is going to start or has started and vice versa.
Finally, the slowing down of the economy has started from the beginning of 2016 because the trend is changing to downward (as shown in chart 3). Generally speaking, if the recession hits the market -we hope not- the curve will cross down the average line or get closer to it. Futuristically, predicting the upcoming recession needs more time (around 12 months) to reveal certain signs.